What Is Mean Average Precision
Published on
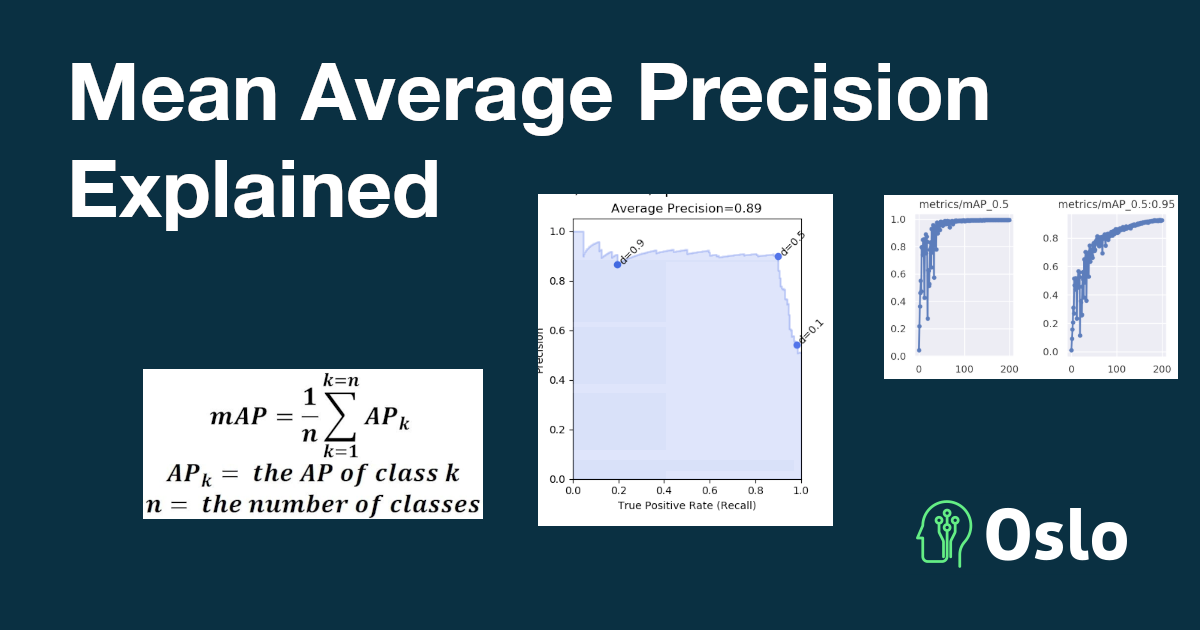
A Beginner’s Guide to Mean Average Precision and Its Importance
Mean Average Precision (mAP) is a widely used evaluation metric that measures the performance of object detection models in computer vision. It provides a comprehensive assessment of a model’s ability to accurately detect and localize objects within images or videos.
In this article, we’ll dive into the concept of Mean Average Precision, exploring its definition, calculation, and significance in the context of object detection. We’ll also examine the key components that contribute to mAP, including precision, recall, and the Intersection over Union (IoU) metric.
What is Mean Average Precision (mAP)?
Mean Average Precision (mAP) is a popular evaluation metric used to measure the accuracy of object detection models. It calculates the average precision value for recall values ranging from 0 to 1, providing a single number that summarizes the model’s performance across different thresholds.
mAP is based on several key sub-metrics:
- Confusion Matrix: A table that categorizes predictions into True Positives (TP), False Positives (FP), True Negatives (TN), and False Negatives (FN).
- Precision: The proportion of true positive predictions among all positive predictions. It measures how accurate the model is when it predicts an object.
- Recall: The proportion of true positive predictions among all actual positive instances. It measures how well the model captures all the relevant objects.
- Intersection over Union (IoU): A measure of overlap between the predicted bounding box and the ground truth bounding box. It is calculated as the area of intersection divided by the area of union.
For an explanation of confusion matrix, precision and recall please refer to the previous blog post.
Intersection over Union (IoU) Explanation
The Intersection over Union (IoU) between a predicted bounding box $ B_p $ and a ground truth bounding box $ B_{gt} $ is calculated as:
$$ \text{IoU} = \frac{|B_p \cap B_{gt}|}{|B_p \cup B_{gt}|} $$
where $ |B_p \cap B_{gt}| $ is the area of overlap between the predicted and ground truth boxes, and $ |B_p \cup B_{gt}| $ is the area covered by both boxes combined.
This essential metric is crucial for evaluating the accuracy of object detection models, as it quantifies how well the predicted bounding boxes align with the actual objects in the image. A higher IoU indicates a better match between the predicted and ground truth boxes, which is vital for achieving high mAP scores.
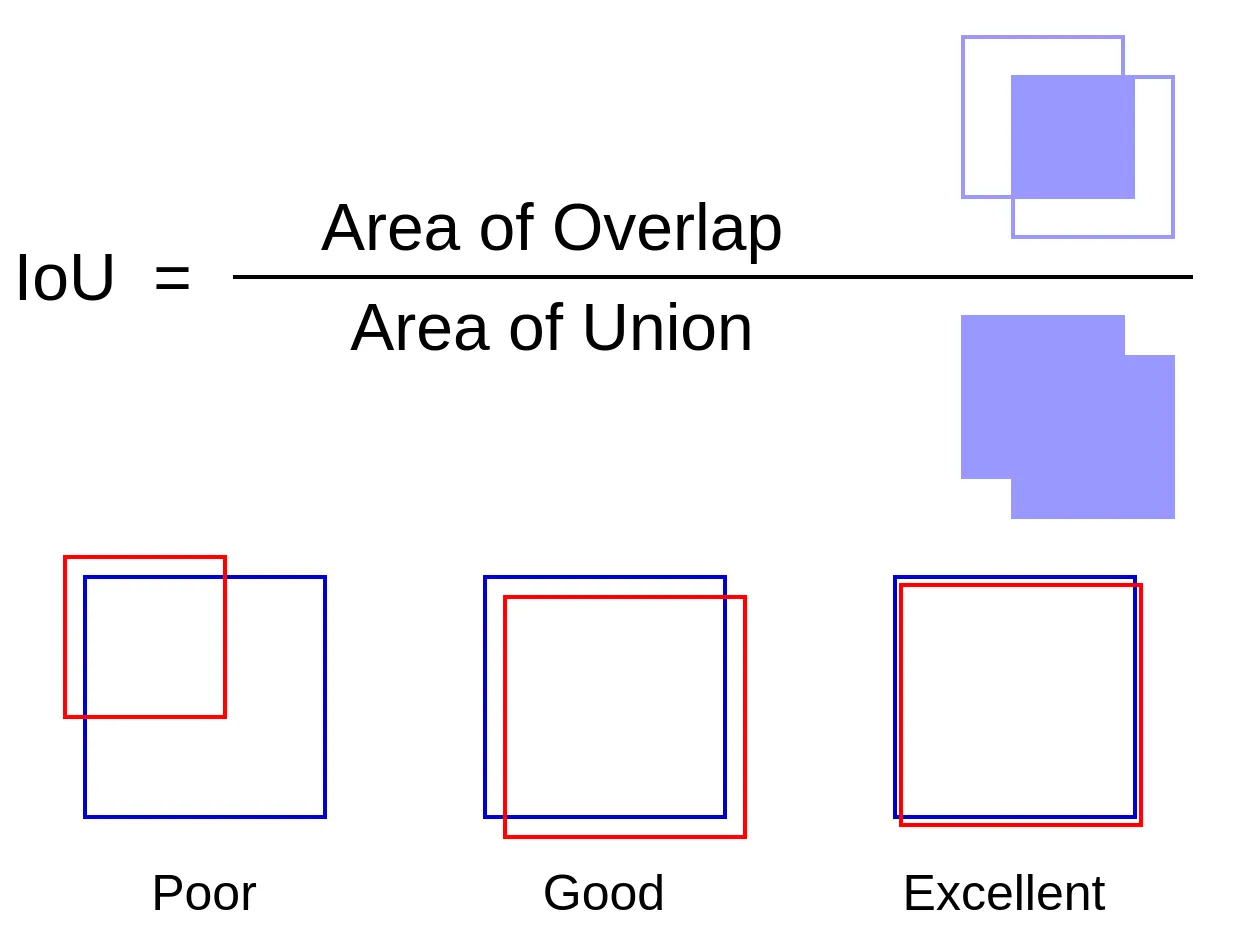
IoU Explanation
To calculate mAP, the object detection model generates prediction scores for each detected object. For each class (and, in some benchmarks, for each IoU threshold), a precision-recall curve is plotted. The area under this curve (AUC) represents the Average Precision (AP) for that class (and threshold). The mAP score is obtained by averaging the AP values across all classes (and, if applicable, across IoU thresholds).
In some benchmarks (like COCO), mAP is averaged over multiple IoU thresholds (e.g., from 0.5 to 0.95 in steps of 0.05). Where with YOLO it is calculated at a single IoU threshold (usually 0.5). But it is useful to use both methods to evaluate the model’s performance across different levels of detection accuracy.
At Oslo, we understand the importance of mAP in developing and optimizing Vision AI models. By leveraging advanced techniques like active learning and collaborative labeling, our platform helps streamline the dataset management and annotation process, ultimately leading to improved mAP scores and more accurate object detection models.
Why is mAP Important for Object Detection?
Mean Average Precision (mAP) stands as a critical metric in object detection, providing a nuanced analysis of a model’s effectiveness. By integrating both precision and recall, mAP offers a thorough evaluation that captures a model’s proficiency in accurately identifying objects and detecting a wide array of relevant instances. This dual focus makes mAP an essential tool for developers and researchers aiming to refine Vision AI models.
Understanding the Precision-Recall Curve
The precision-recall (PR) curve is a fundamental tool for visualizing and evaluating the performance of object detection models, especially in scenarios with imbalanced datasets. It illustrates the trade-off between precision and recall at various confidence thresholds.
- Precision measures the proportion of true positive detections among all positive predictions made by the model.
- Recall measures the proportion of true positive detections among all actual positive instances in the dataset.
To generate a PR curve, the model’s predictions are sorted by their confidence scores. As the confidence threshold is varied from high to low, more predictions are considered positive, which typically increases recall but may decrease precision. Each point on the curve represents a specific threshold, plotting recall on the x-axis and precision on the y-axis.
A typical PR curve starts at high precision and low recall (strict threshold) and moves toward lower precision and higher recall (lenient threshold). The area under the PR curve (AUC) is used to compute the Average Precision (AP) for a given class.
Key characteristics of the PR curve:
- A curve that bows closer to the top-right corner indicates better model performance, achieving both high precision and high recall.
- Sudden drops in precision as recall increases may indicate that the model is making more false positive predictions at lower thresholds.
- The shape of the PR curve can help diagnose issues such as overfitting, class imbalance, or poor calibration of confidence scores.
Understanding the PR curve is essential for interpreting mAP, as mAP is calculated by averaging the AP (area under the PR curve) across all classes and, in some cases, across multiple IoU thresholds. This makes the PR curve a central concept in evaluating and improving object detection models.
What Is Considered a Good mAP Value?
Determining what constitutes a “good” mAP value depends on the specific application, dataset complexity, and industry standards. Generally, a higher mAP indicates better object detection performance, but the threshold for “good” can vary:
- Research Benchmarks: On widely used datasets like COCO, an mAP of 0.5 (or 50%) at IoU=0.5 is often considered a baseline for acceptable performance, while state-of-the-art models may achieve mAP values above 0.6 (60%) or even 0.7 (70%) when averaged over multiple IoU thresholds.
- Industrial Applications: In safety-critical domains such as autonomous driving or medical imaging, higher mAP values (often above 0.8 or 80%) may be required to ensure reliability and minimize errors.
- Task Complexity: Simpler tasks with fewer object classes or less variation may yield higher mAP scores, while more complex scenarios with many classes or challenging conditions typically result in lower mAP values.
Ultimately, a “good” mAP is context-dependent. It should be evaluated alongside other metrics and in relation to the specific requirements and risks of the intended application. Comparing mAP scores to established baselines or peer-reviewed results on the same dataset can help set realistic expectations and goals for model performance.
How to Calculate Mean Average Precision (mAP)
Calculating mAP involves several steps that combine precision, recall, and IoU metrics to provide a comprehensive evaluation of an object detection model. Here’s a step-by-step overview:
Collect Predictions and Ground Truths: For each image, gather the predicted bounding boxes, their confidence scores, and the corresponding ground truth boxes.
Set an IoU Threshold: Decide on an IoU threshold (e.g. 0.5). A prediction is considered a True Positive if its IoU with a ground truth box exceeds this threshold; otherwise, it is a False Positive.
Sort Predictions by Confidence: For each class, sort all predictions in descending order of their confidence scores.
Assign True Positives (TP) and False Positives (FP):
- For each prediction, check if it matches a ground truth box (not already matched) with IoU above the threshold.
- If matched, count as TP; if not, count as FP.
- Calculate Precision and Recall:
- Precision = TP / (TP + FP)
- Recall = TP / (Total number of ground truth boxes)
Plot the Precision-Recall Curve: Vary the confidence threshold and plot precision against recall.
Compute Average Precision (AP): Calculate the area under the precision-recall curve for each class. This is typically done using interpolation methods.
Calculate mAP: Take the mean of the AP values across all classes (and, if required, across multiple IoU thresholds).
Example Calculation:
Suppose you have predictions for a single class:
| Prediction | Confidence | IoU with GT | TP/FP |
|---|---|---|---|
| Box 1 | 0.95 | 0.8 | TP |
| Box 2 | 0.90 | 0.6 | TP |
| Box 3 | 0.85 | 0.4 | FP |
| Box 4 | 0.80 | 0.7 | TP |
- Calculate precision and recall at each prediction.
- Plot the precision-recall curve.
- Compute the AP as the area under this curve.
- Repeat for all classes and average to get mAP.
Many frameworks (like PyTorch, TensorFlow, and scikit-learn) provide utilities to automate these calculations, but understanding the process helps in interpreting and troubleshooting results.
Comparing mAP and F1 Metrics
Both Mean Average Precision (mAP) and the F1 score are widely used metrics for evaluating machine learning models, but they serve different purposes and are suited to different tasks.
F1 Score: The F1 score is the harmonic mean of precision and recall, providing a single value that balances both metrics. It is commonly used in binary and multi-class classification problems, where each prediction is assigned to a single class. The F1 score is particularly useful when the dataset is imbalanced, as it penalizes extreme values of precision or recall.
Mean Average Precision (mAP): mAP is specifically designed for object detection tasks, where models predict multiple bounding boxes per image, each with a confidence score. Unlike the F1 score, mAP evaluates the model’s performance across a range of confidence thresholds and IoU values, averaging the precision over all recall levels and classes. This makes mAP a more comprehensive metric for tasks involving localization and multiple object classes.
Key Differences:
| Aspect | F1 Score | mAP |
|---|---|---|
| Use Case | Classification | Object Detection |
| Calculation | Harmonic mean of precision and recall at a fixed threshold | Average of precision across recall levels and classes |
| Handles IoU | No | Yes |
| Multiple Classes | Supports, but less granular | Explicitly averages over all classes |
| Localization | Not considered | Explicitly evaluated |
In summary, while the F1 score is ideal for classification tasks with discrete outputs, mAP provides a more nuanced and thorough evaluation for object detection models that must both classify and localize objects within images.
Improving mAP in Object Detection Models
Boosting the Mean Average Precision (mAP) of object detection models requires innovative approaches in data preprocessing and model optimization. A fundamental strategy is to employ advanced data augmentation methods, which expand the variety of training datasets by introducing controlled alterations. Techniques such as random cropping, color jittering, and perspective transformations enhance the model’s adaptability to new data distributions. This breadth in training data helps reduce overfitting, enabling the model to generalize better across diverse applications.
Another effective approach involves the use of ensemble methods, where multiple models are combined to improve prediction accuracy. By aggregating the outputs of different models, each with unique strengths, ensemble methods can provide a more comprehensive understanding of the data. This approach not only enhances mAP but also increases the robustness of predictions in real-world scenarios.
As we continue to push the boundaries of object detection and computer vision, Mean Average Precision will remain a crucial metric for evaluating and refining our models. By understanding the intricacies of mAP and its role in shaping the performance of Vision AI systems, we can develop more accurate, reliable, and efficient solutions that revolutionize industries and improve our daily lives. If you’re ready to embark on your own Vision AI journey and experience the power of advanced tools and collaborative workflows, sign up for a free account to explore Oslo’s Vision AI platform today and let us help you bring your ideas to life.